Plotlyで複数のグラフを表示させる
Plotlyで複数のグラフを表示させる
■Plotlyで複数のグラフを表示させる
from plotly import tools

# make trace
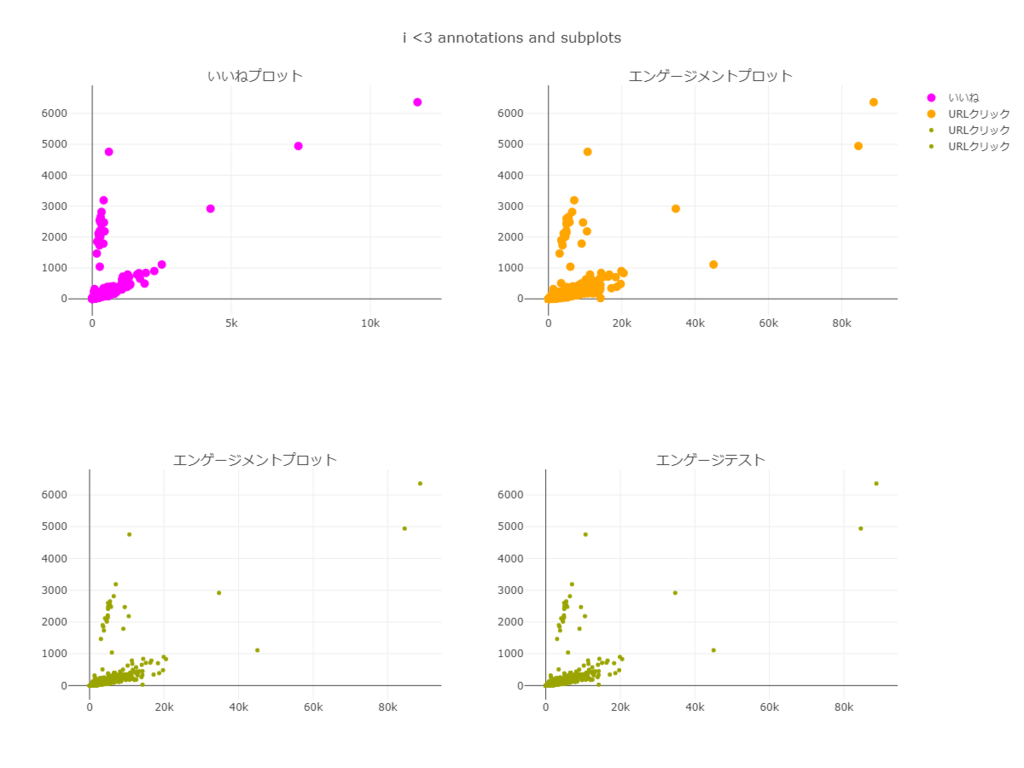
trace0 = go.Scatter(
    x = report["いいね"],
    y = report["リツイート"],
    name = "いいね",
    mode = "markers",
    marker = dict(size=10, color="rgb(255, 0, 255)")) # markerで大きさや色などのstyleを変更できます.

trace1 = go.Scatter(
    x = report["エンゲージメント"],
    y = report["リツイート"],
    name = "URLクリック",
    mode = "markers",
    marker = dict(size=10, color="rgb(255, 165, 0)"))


trace3 = go.Scatter(
    x = report["エンゲージメント"],
    y = report["リツイート"],
    name = "URLクリック",
    mode = "markers",
    marker = dict(size=5, color="rgb(155, 165, 0)"))


fig = tools.make_subplots(rows=2, cols=2,subplot_titles=("いいねプロット","エンゲージメントプロット","エンゲージメントプロット","エンゲージテスト"))

fig.append_trace(trace0, 1, 1)
fig.append_trace(trace1, 1, 2)
fig.append_trace(trace3, 2, 1)
fig.append_trace(trace3, 2, 2)

fig['layout'].update(height=900, width=1200, title='i <3 annotations and subplots')
plotly.offline.iplot(fig)

import plotly.plotly as py
import plotly.graph_objs as go
import plotly.figure_factory as ff

table_data = [['Team', 'Wins', 'Losses', 'Ties'],
              ['Montréal<br>Canadiens', 18, 4, 0],
              ['Dallas Stars', 18, 5, 0],
              ['NY Rangers', 16, 5, 0],
              ['Boston<br>Bruins', 13, 8, 0],
              ['Chicago<br>Blackhawks', 13, 8, 0],
              ['LA Kings', 13, 8, 0],
              ['Ottawa<br>Senators', 12, 5, 0]]

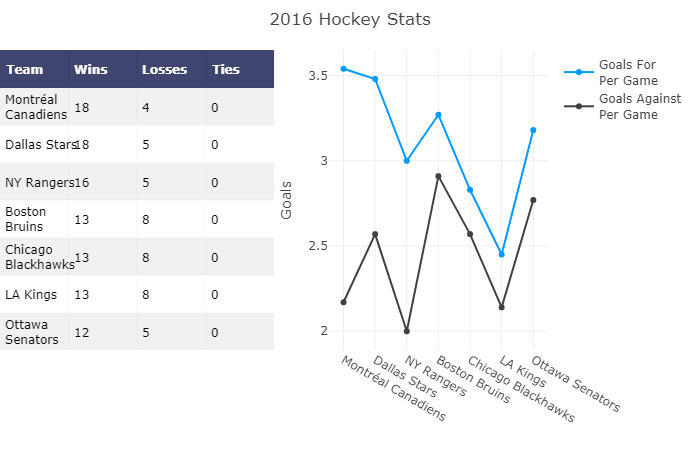
figure = ff.create_table(table_data, height_constant=60)

teams = ['Montréal Canadiens', 'Dallas Stars', 'NY Rangers',
         'Boston Bruins', 'Chicago Blackhawks', 'LA Kings', 'Ottawa Senators']
GFPG = [3.54, 3.48, 3.0, 3.27, 2.83, 2.45, 3.18]
GAPG = [2.17, 2.57, 2.0, 2.91, 2.57, 2.14, 2.77]

trace1 = go.Scatter(x=teams, y=GFPG,
                    marker=dict(color='#0099ff'),
                    name='Goals For<br>Per Game',
                    xaxis='x2', yaxis='y2')
trace2 = go.Scatter(x=teams, y=GAPG,
                    marker=dict(color='#404040'),
                    name='Goals Against<br>Per Game',
                    xaxis='x2', yaxis='y2')

figure['data'].extend(go.Data([trace1, trace2]))

# Edit layout for subplots
figure.layout.xaxis.update({'domain': [0, .5]})
figure.layout.xaxis2.update({'domain': [0.6, 1.]})
# The graph's yaxis MUST BE anchored to the graph's xaxis
figure.layout.yaxis2.update({'anchor': 'x2'})
figure.layout.yaxis2.update({'title': 'Goals'})
# Update the margins to add a title and see graph x-labels.
figure.layout.margin.update({'t':50, 'b':100})
figure.layout.update({'title': '2016 Hockey Stats'})

plotly.offline.iplot(figure)

# import plotly.plotly as py
import plotly.graph_objs as go

import numpy as np
import pandas as pd

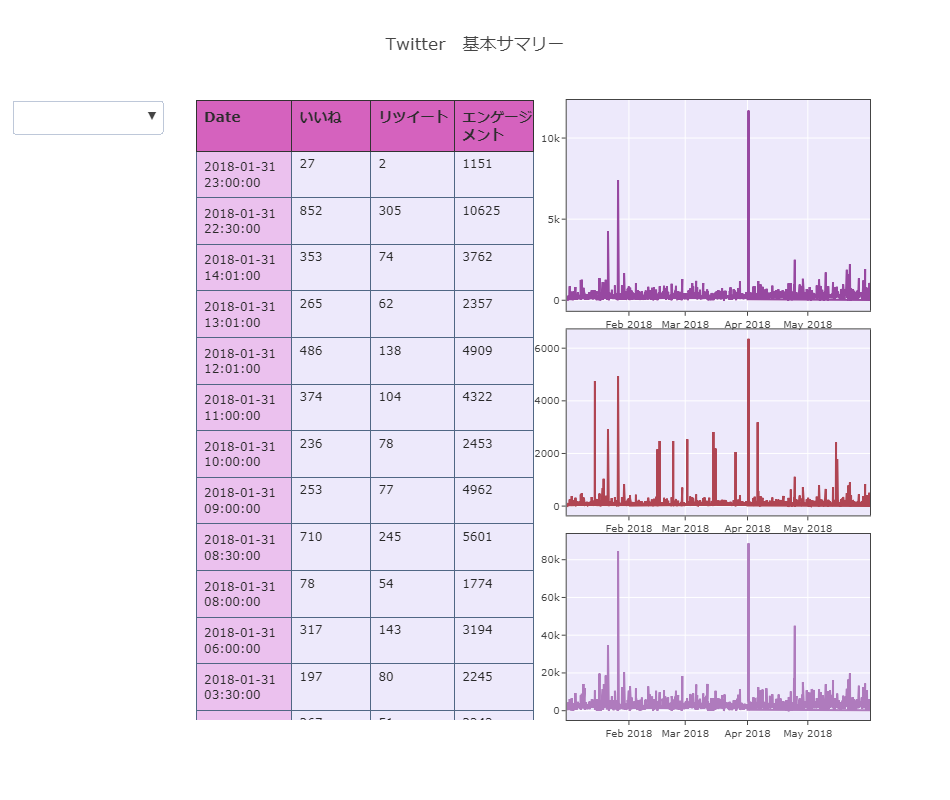
table_trace1 = go.Table(
    domain=dict(x=[0, 0.5],
                y=[0, 1.0]),
    columnwidth = [40] + [33, 35, 33],
    columnorder=[0, 1, 2, 3, 4],
    header = dict(height = 50,
                  values = [['<b>Date</b>'],['<b>いいね</b>'],
                            ['<b>リツイート</b>'], ['<b>エンゲージ<br>メント</b>']],
                  line = dict(color='rgb(50, 50, 50)'),
                  align = ['left'] * 5,
                  font = dict(color=['rgb(45, 45, 45)'] * 5, size=14),
                  fill = dict(color='#d562be')),
    cells = dict(values = [report[k].tolist() for k in
                          ['time', 'いいね', 'リツイート', 'エンゲージメント']],
                 line = dict(color='#506784'),
                 align = ['left'] * 5,
                 font = dict(color=['rgb(40, 40, 40)'] * 5, size=12),
#                  format = [None] + [", .2f"] * 2 + [',.4f'],
#                  prefix = [None] * 2 + ['$', u'\u20BF'],
                 suffix=[None] * 4,
                 height = 27,
                 fill = dict(color=['rgb(235, 193, 238)', 'rgba(228, 222, 249, 0.65)']))
)

trace1=go.Scatter(
    x=report['time'],
    y=report['いいね'],
    xaxis='x1',
    yaxis='y1',
    mode='lines',
    line=dict(width=2, color='#9748a1'),
    name='いいね推移'
)

trace2=go.Scatter(
    x=report['time'],
    y=report['リツイート'],
    xaxis='x2',
    yaxis='y2',
    mode='lines',
    line=dict(width=2, color='#b04553'),
    name='リツイート推移'
)

trace3=go.Scatter(
    x=report['time'],
    y=report['エンゲージメント'],
    xaxis='x3',
    yaxis='y3',
    mode='lines',
    line=dict(width=2, color='#af7bbd'),
    name='transact-fee'
)

axis=dict(
    showline=True,
    zeroline=False,
    showgrid=True,
    mirror=True,
    ticklen=4,
    gridcolor='#ffffff',
    tickfont=dict(size=10)
)

layout1 = dict(
    width=950,
    height=800,
    autosize=False,
    title='Twitter 基本サマリー',
    margin = dict(t=100),
    showlegend=False,
    xaxis1=dict(axis, **dict(domain=[0.55, 1], anchor='y1', showticklabels=True)),
    xaxis2=dict(axis, **dict(domain=[0.55, 1], anchor='y2', showticklabels=True)),
    xaxis3=dict(axis, **dict(domain=[0.55, 1], anchor='y3')),
    yaxis1=dict(axis, **dict(domain=[0.66, 1.0], anchor='x1', hoverformat='.2f')),
    yaxis2=dict(axis, **dict(domain=[0.3 + 0.03, 0.63], anchor='x2',  hoverformat='.2f')),
    yaxis3=dict(axis, **dict(domain=[0.0, 0.3], anchor='x3', hoverformat='.2f')),
    plot_bgcolor='rgba(228, 222, 249, 0.65)',
    updatemenus=updatemenus
)


fig1 = dict(data=[table_trace1, trace1, trace2, trace3], layout=layout1)


updatemenus = list([
    dict(active=-1,
         buttons=list([
            dict(label = 'いいね',
                method = 'update',
                 args = [{'visible': [True,False, True,False]},
                         {'title': 'いいね推移',
                          'annotations': annotations1}]),
            dict(label = 'Reset',
                 method = 'update',
                 args = [{'visible': [True,True, True,True]},
                         {'title': 'いいねとリツイート数とエンゲージメント数',
                          'annotations': []}])

        ]),
    )
])


plotly.offline.iplot(fig1)

import plotly.plotly as py
import plotly.graph_objs as go

from datetime import datetime

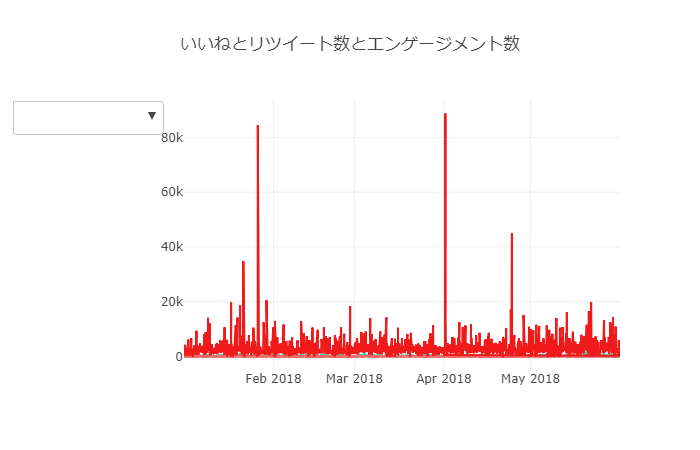
trace_0 = go.Scatter(x=list(report.time),
                        y=list(report.いいね),
                        mode = 'lines',
                        name='いいね',
                        line=dict(color='#33CFA5'))


trace_1 = go.Scatter(x=list(report.time),
                       y=list(report.リツイート),
                       mode = 'lines',
                       name='リツイート',
                       line=dict(color='#F06A6A'))

trace_2 = go.Scatter(x=list(report.time),
                       y=list(report.エンゲージメント),
                       mode = 'lines',
                       name='エンゲージメント数',
                       line=dict(color='#F01A1A'))


data = [trace_0,trace_1,trace_2]

annotations1=[dict(x=report.time,
                       y=report.いいね)]

annotations2=[dict(x=report.time,
                      y=report.リツイート)]

annotations3=[dict(x=report.time,
                      y=report.エンゲージメント)]


updatemenus = list([
    dict(active=-1,
         buttons=list([
            dict(label = 'いいね',
                 method = 'update',
                 args = [{'visible': [True, False,False]},
                         {'title': 'いいね推移',
                          'annotations': annotations1}]),
            dict(label = 'リツイート',
                 method = 'update',
                 args = [{'visible': [False, True,False]},
                         {'title': 'リツイート推移',
                          'annotations': annotations2}]),
            dict(label = 'エンゲージメント数',
                 method = 'update',
                 args = [{'visible': [False, False,True]},
                         {'title': 'エンゲージメント数',
                          'annotations': annotations3}]),
            dict(label = 'Reset',
                 method = 'update',
                 args = [{'visible': [True, True,True]},
                         {'title': 'いいねとリツイート数とエンゲージメント数',
                          'annotations': []}])

        ]),
    )
])

layout = dict(title='いいねとリツイート数とエンゲージメント数', showlegend=False,
              updatemenus=updatemenus)

fig = dict(data=data, layout=layout)
plotly.offline.iplot(fig)
# fig = go.Figure(data=data, layout=layout)


trace0 = go.Bar(
    x=['Jan', 'Feb', 'Mar', 'Apr', 'May', 'Jun',
       'Jul', 'Aug', 'Sep', 'Oct', 'Nov', 'Dec'],
    y=[20, 14, 25, 16, 18, 22, 19, 15, 12, 16, 14, 17],
    name='Primary Product',
    marker=dict(
        color='rgb(49,130,189)'
    )
)
trace1 = go.Bar(
    x=['Jan', 'Feb', 'Mar', 'Apr', 'May', 'Jun',
       'Jul', 'Aug', 'Sep', 'Oct', 'Nov', 'Dec'],
    y=[19, 14, 22, 14, 16, 19, 15, 14, 10, 12, 12, 16],
    name='Secondary Product',
    marker=dict(
        color='rgb(204,204,204)',
    )
)

data = [trace0, trace1]
layout = go.Layout(
    xaxis=dict(tickangle=-45),
    barmode='group',
)

fig = go.Figure(data=data, layout=layout)
plotly.offline.iplot(fig)
